COVID-19 Pandemic Estimations - Ongoing Projects
We bring to your attention a number of on-going projects utilizing (partially or wholly) the data provided through this platform's. Note that we are not responsible for the results presented, as these belong to the discretion and work of the different research teams conducting them.
Goal: Monitoring the Incidence of COVID-19 via Open Surveys.
Contributed by: An international team of researches lead by Prof. Antonio Fernández Anta @IMDEA
- Project Website @CoronaSurveys: Monitoring the Incidence of COVID-19 via Open Surveys.
- GitHub Code @CoronaSurveys.
Short Description
The world is suffering from a pandemic called COVID-19, caused by the SARS-CoV-2 virus. The different national governments have problems evaluating the reach of the epidemic, having limited resources and tests to their disposal. Hence, any means to evaluate the number of persons with symptoms compatible with COVID-19 with reasonable level of accuracy is useful.
Participate!
Please complete our surveys! Choose a country in which you have contacts, and tell us about the number of cases (suspected or confirmed) you know about. No personal information is stored in these surveys. Because each of us can provide information about the situation among our direct contacts, in aggregate we are able to get rough estimates of total cases. Because we are tracking the evolution of this epidemic over time, once you have completed the survey, please remember to come back and update the survey every day. And finally, you can help us by asking your friends, colleagues and relatives to complete the survey as well! Thank you!
Latest Estimates
Goal: Projections based on Richard’s model for COVID-19 Outbreak In Cyprus..
Contributed by: Evagoras Xydas IREROBOT Ltd
- Project Website: https://irerobot.com/covid-19-projections-for-cyprus/
Short Description
Researchers have shown that even simple empirical models stemming from biological growth modeling have the potential to provide useful information on the development and severity of ongoing epidemics since they can be employed as tools for carrying out projections on the size of the affected population, timing of turning points, as well as best- and worst-case scenarios. Nevertheless, they commonly exhibit considerable sensitivity to some input parameters' variance which results in large fluctuations in the generated projections, thus rendering predictions difficult and even risky. In this work we examine a novel meta-projections-based approach which allows us to evaluate the model's current trends and assess whether generated projections are at a transient or stable state. Meta-projections can be extracted from graphs of successive estimations of model's parameters and resulting projections, over a sequence of days being gradually added to the employed model. In other words, projections are carried out on truncated time series of cumulative numbers of confirmed cases with increased lengths at each successive evaluation. This allows us to trace the values of model parameters over a certain period of time and examine their trends which may converge to specific values for settled-growth cases or exhibit a changing or even an erratic behavior for cases that undergo epidemiological transitions and/or are inappropriately described by the current model instance(s). We have computed meta-projections and compared our findings for countries at different stages of the epidemic with stable or unstable behaviors and increasing or decreasing numbers of confirmed cases. Our results indicate that meta-projections can aid researchers in assessing the appropriateness of their relevant models and in effect decrease the uncertainty in their estimations of an epidemic's severity and development.
Publications
Xydas, E., & Kostas, K. (2020). Qualitative and quantitative evaluation of COVID-19 outbreak severity with the use of meta-projections based on Richards' curve parameters. (e-print: arXiv:2004.12398)
Latest Estimates
The projections are based on Richard’s model [1]. Unlike the SIR model [2] that accounts for the mechanisms of transmission, Richard’s model is a based on an empirical function derived from the General Logistic Growth model, which has been shown to demonstrate the natural course of biological growths including that of the infected people during an epidemic. It has been a mystery that this empirical function has made many incredible coincidences with real ecological or epidemic data given the weak correlation of its parameters to actual biological and epidemiological data.
The Richard’s model is described by the following non-linear differential equation:
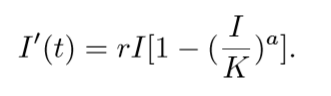
The solution of the above equation gives:
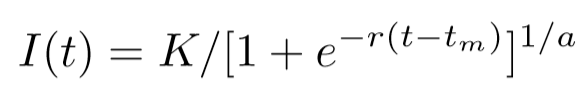
Where I(t) is the cumulative number of infected people (cases), r is the per capita growth rate, K is the infection capacity (essentially the steady-state value) and tm is the time of the inflection point or the time at which the slope of the graph starts reducing. α causes deviation from the basic curve and it has been linearly correlated to the reproduction number r0. How to interpret the curve: As with every predictive model, the chance that we can use Richard’s model to accurately predict the course of a pandemic early-on, is low. Nevertheless, the curve can be used as an indication of the current trends with reference to a natural epidemic growth. It can show us the shape of the total covid-19 cases increase over time, and whether currently, we are heading steadily towards our projected target or whether we need to improve our response, i.e. by increasing measures.
References:
[1] Hsieh, Ying-Hen. (2009). Richards Model: A Simple Procedure for Real-time Prediction of Outbreak Severity. Modeling and Dynamics of Infectious Diseases Series in Contemporary Applied Mathematics (CAM). 11. 10.1142/9789814261265_0009.
[2] Kermack, W. O. and McKendrick, A. G. “A Contribution to the Mathematical Theory of Epidemics.” Proc. Roy. Soc. Lond. A115, 700-721, 1927.
Goal: Predict the number of infections using the SIR Model estimate.
Original Implementation by: Kai Sasaki
- Project Website: https://www.lewuathe.com/covid-19-dynamics-with-sir-model.html
- GitHub Code @Lewuathe/COVID19-SIR.
Short Description
The outbreak of the novel coronavirus disease (Covid-19) brought considerable turmoil all around the world. Although the number of new patients in the mainland Child is restrained, the other countries are still struggling with the increasing number of new cases. I sincerely hope the situation will get better soon. At the same time, I am interested in how the spread of infectious diseases such as Covid-19 can happen. Is there anything we know about the mechanism of the spread disease? I have found there is a simple mathematical model named SIR model describing the structure of how the infectious disease. The assertion by the model is so interesting to me even it is simple to explain. This post aims to deliver an overview of the SIR model and the outcome of my simulation by using the dataset of Covid-19.
Latest Estimates
The project adjusts the SIR model parameters in order to take into account the number of recovered people and this is achieved by modifying the loss function to consider the recovered people too. The following chart illustrates the result of this methodology for Cyprus.